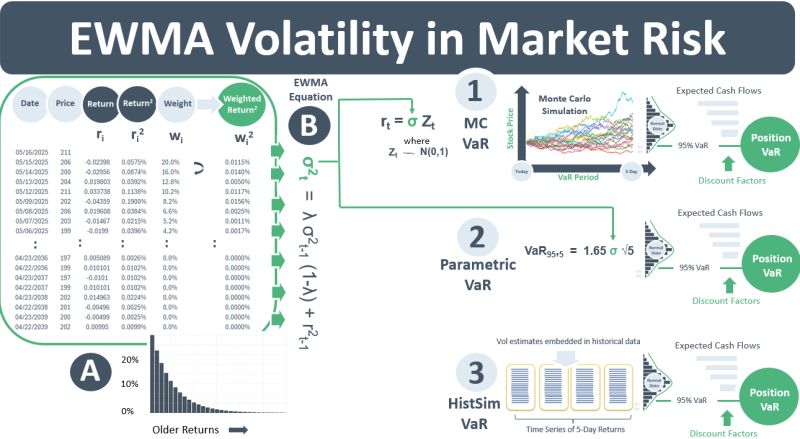
A sales rep has a 20% chance of making a sale on a call. What is the probability that she makes a sale on exactly the 5th call? The answer can be found in a chart that looks like Chart A below. If the sale is not made on the first call, the 20% probability of a sale decreases by 20% to 16% for the 2nd call. And by another 20% to 12.8% for the third call. The prob that a sale is made on exactly the 5th call is 8.2%.
Chart A looks like probability mass function of a geometric distribution (GD) with p = 20%. It could represent the GD prob decreasing exponentially by 20% after each call. However, Chart A is not the PMF of a GD. It is a plot of the weights that are applied to the historical daily returns of a price time series under the exponentially weighted moving avg (EWMA) methodology for deriving the volatility of the instrument. The chart looks like a GD because the EWMA vol estimation method shares mathematical foundations with the GD. But instead of probabilities decreasing exponentially by 20%, in EWMA the weights applied to returns when deriving vol decrease exponentially by 20%.
Volatility is the most important parameter in both derivative valuations and market risk. There are two ways of estimating it. The first is implied volatility (IV). This is the estimation of vol from market quotes of options traded in active markets. IV is used for derivative valuations under the no-arbitrage paradigm. The second is historical vol (HV). The primary use for HV is in market risk models such as VaR.
EWMA is an approach for calculating HV. Empirical data tells us that vol occurs in clusters. One way of accounting for this is to assume that recent returns are more important than older returns in time series data. This is what EWMA does.
In market risk, there are three types of VaR models: 1) Monte Carlo VaR, 2) parametric VaR, and 3) HistSim VaR. Each requires an estimate for vol. When EWMA is used as the vol estimation approach, it does so in different ways for the three VaR methods. In the MC VaR model shown in diagram 1 below, the returns over the 5-day VaR period are simulated using the vol parameter, σ, which is calculated using EWMA equation B. As the VaR period is only 5 days, however, a time-varying EWMA vol would have no impact on the VaR result. Instead, the current EWMA vol estimate is used and assumed to be constant over the 5-day VaR period. Similarly, with parametric VaR, the current EWMA estimate, calculated from the time series of returns using equation B, is plugged into the parametric VaR equation shown in 2) below.
For the HistSim VaR method the approach is different. Historical time series data is assumed to be taken from the actual historical price observations used in the VaR model, and therefore already contains the vol clustering that EWMA attempts to account for. EWMA, GARCH and other vol estimation approaches are not required under HistSim.

