In statistics, the variance of two variables X and Y, say people’s height and weight, can be summed to get the variance of the combined (X+Y) variable. The formula is Var(X + Y) = Var(X) + Var(Y) + 2.Cov(X,Y) where Cov(X,Y) describes how the two variables move together or covary. If there is no relationship btw height and weight, then Cov(X,Y) would be zero and the combined variance would just be sum of the two variances. But there is a +ve correlation btw height & weight so the Cov(X,Y) term adds to the overall variance. If the correlation was negative then Cov(X,Y) would subtract from it.
In the 1950s Harry Markowitz applied variance-covariance techniques to movements of stock prices in a portfolio. The analysis was groundbreaking at the time. The variance, or risk, of a portfolio, he argued, was higher if there was +ve correlation btw the movements of two stocks in the portfolio. A matrix containing variances and covariances, calculated from historical time series of price movements across all stock pairs, defined the risk of the portfolio.
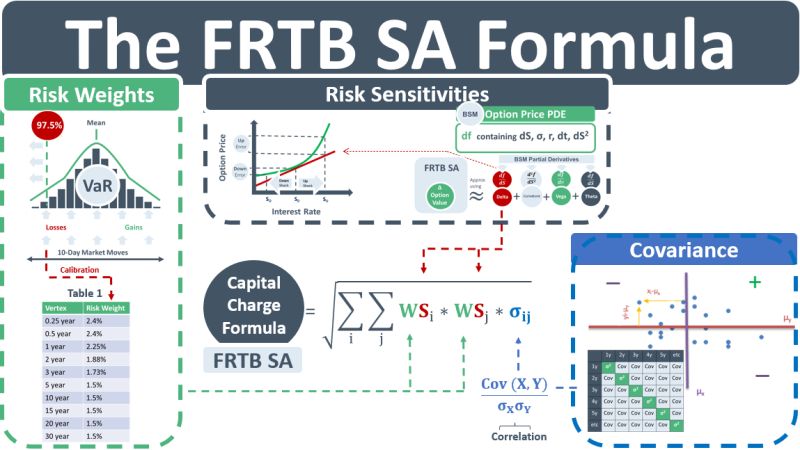
In the 1990s market risk teams in banks started using Markowitz’s theory for another objective: to measure the value-at-risk (VaR) of their trading books. The total VaR, say in a trading book containing IR exposures with tenor buckets per Table 1 in the diagram below, is not just the sum of the individual risk-weighted exposures. If it were, then +ve exposure buckets could be directly offset with negative exposure buckets. The total capital charge is higher than the sum of the weighted exposures because the underlying tenor rates are highly +vely correlated.
In the FRTB SA capital charge formula below, the risk weights Wi are analogous to the variances in Markowitz. However, instead of being set directly = to the variances of the IR variables, e.g. the variance of the 1Y rate, the risk weights are calibrated to the 97.5th percentile of a time-series of 10-day market moves of the rate. Table 1 shows the risk-weights provided in the FRTB document post-calibration. The document doesn’t provide any evidence of the calibration. It just states the 97.5th percentile calibration assumption.
The risk sensitivities Si in the formula are analogous to asset weights in Markowitz. E.g., the sensitivity in the 1Y bucket is an exposure to a 1bp move in the 1Y rate. A high sensitivity => a large position => a high weighting will be applied to the 1Y risk weight of 2.25% obtained from Table 1.
The correlations from the FRTB SA formula below are obtained from a correlation matrix provided in the FRTB document. They are analogous to Markowitz asset correlations. Because interest rates for tenors on the yield curve typically move up and down in parallel with each other, the correlations used in the IR FRTB SA formula will be high – leading to a higher capital charge. Per Markowitz, high +ve correlations lead to higher portfolio risk.